
US imports in the first half of 2022 were even higher than the pre-pandemic level. Every month till July in 2022 was a record month compared to previous years for US ports. Moreover, July was the third-busiest month of 2022 so far in the eastbound trans-Pacific. But this situation did not last long. Why were US imports 2022 so high and then they plummeted?

US imports 2022
First seven months of 2022
US imports totaled 2.53 million 20ft equivalent units in July 2022. They were up 3% year-on-year, which also means that they were up 15% compared to the pre-pandemic level (July 2019). It was the best July on record and the fifth-highest volume ever recorded. The numbers were high despite canceled orders amounting to billions of dollars. Near all-time import highs contributed to long queues of waiting ships. Longer wait times for ships make managing supply chain performance challenging.

July 2022 was also a record month for imports from China within the same year. Chinese goods accounted for 75% of the year-on-year TEU increase in the US (totaling 994,927 TEUs).
Check how to clear Chinese goods in the US.
It is said that inflation, slowing economy, and high fuel costs have not had such a negative impact as anticipated. As a result, the top 10 US ports were up 0.7% y-o-y in July 2022. While the biggest Gulf Coast and East Coast ports’ imports rose by 6.6%, imports at West Coast ports declined by 4.9%. For example, The Northwest Seaport Alliance (NWSA), a partnership between the Port of Seattle and the Port of Tacoma, has seen decreased import TEU volumes in July by 30.4%. The growth is dampened by:
- import dwell time causing congestion
- port congestion in Asia (linked to COVID-19 restrictions)
- supply chain bottlenecks
- no capacity to meet demand at regional warehouses.
US imports in 2022 plummeted
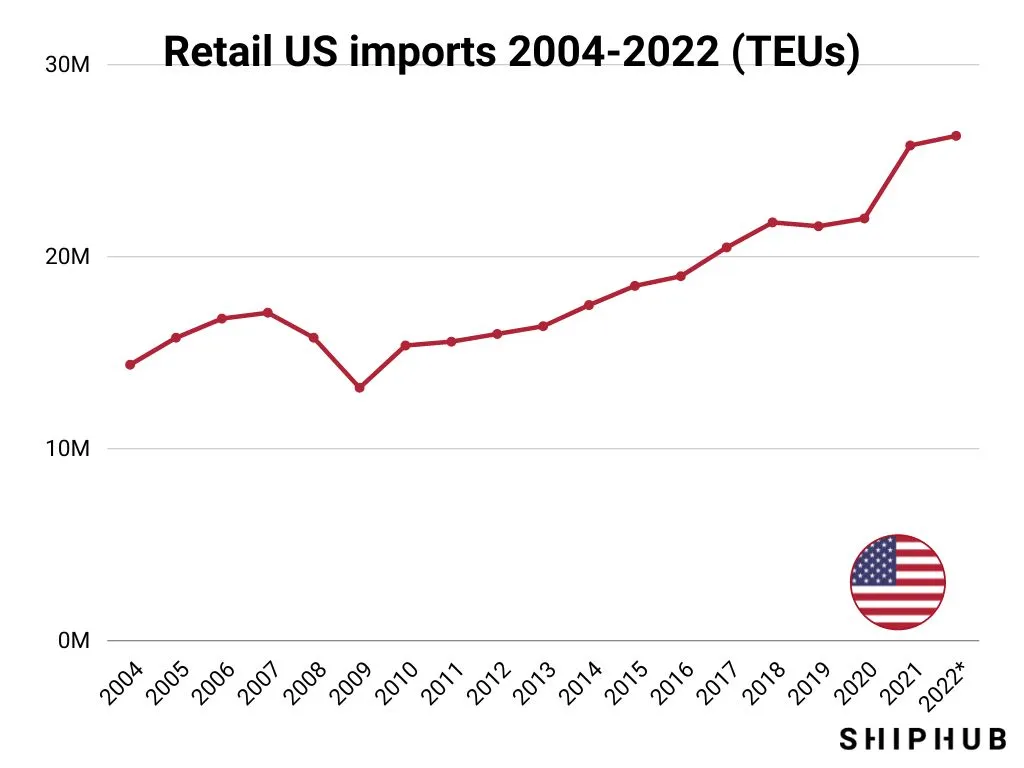
After great July and August records, US imports plunged. There was a slight improvement in October, and then a decline again. If we look closely at the graph, the October-November decline is typicall, but in 2022, it was severe. The November 2022 drop was the steepest since 2016.
The declines were apparent on both the West Coast (Long Beach, Oakland, and Los Angeles average drop by 12.3%) and the East and Gulf Coast ports (Charleston, New York/New Jersey, Norfolk, Savannah and Houston, average drop by 12.5%). However, the ship wait time is better on the West Coast (7 days) compared to the East and Gulf Coast (10 days). The trend of lower US port numbers is due to falling imports from Asia and Europe:
- China
- Thailand
- Vietnam
- Germany
- Italy
- Taiwan
- South Korea
- India
- Hong Kong.
What does the future hold for US imports?
US imports are expected to keep dropping till at least June 2023. Projected volumes of February and March 2023 are estimated to be 20.9% and 18.6% lower than in the previous year.
Many US ports, especially the biggest ports in the US, are about to hit the capacity ceiling. Port congestion is a significant issue, and it will remain that way until some changes are introduced to the infrastructure. New container terminals, or new container ports even, are the solution—this way, growing demand can be handled in the US effectively.
See the top container ports 2022!